Dashboards
Dashboards as Visual Composition
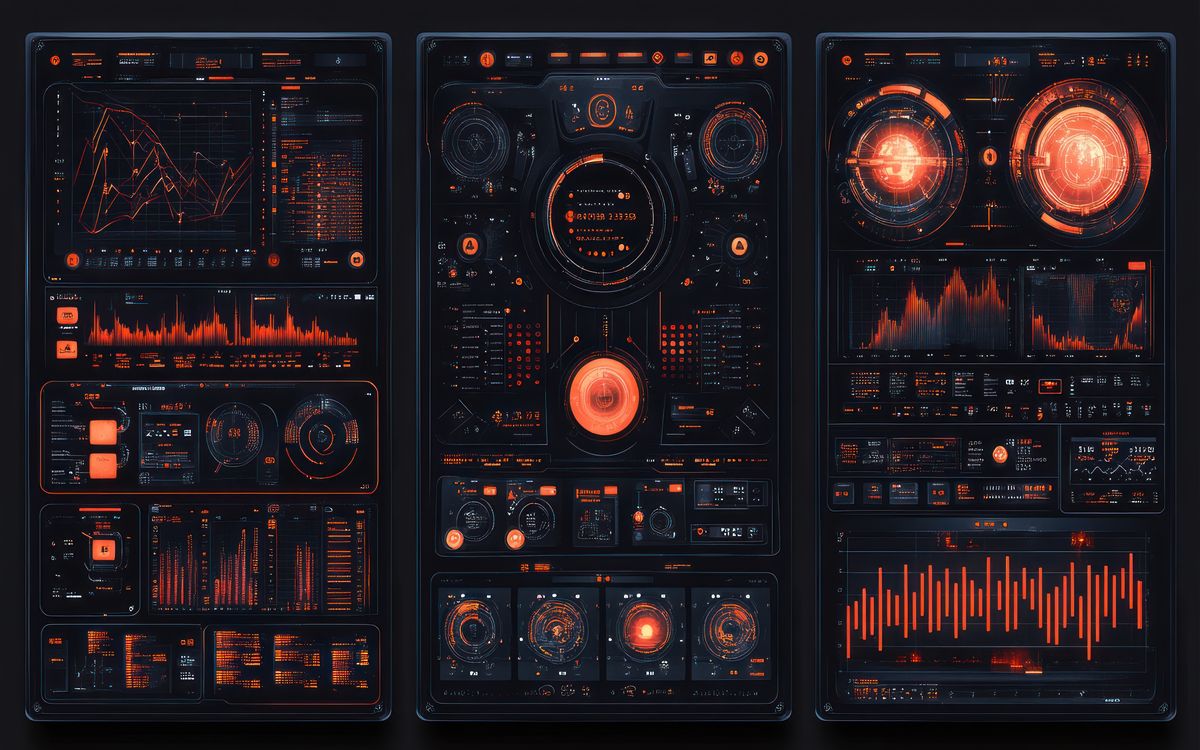
Dashboard interfaces are among the most visually dense things you can build in a browser. They combine layout, typography, color coding, data visualization, and interactive controls into a single view that needs to communicate clearly at a glance. Getting the composition right is as much a design challenge as a technical one.
This collection features dashboard components and full-layout recreations that demonstrate how to structure information-rich interfaces using CSS Grid, Flexbox, SVG charts, and vanilla JavaScript. The focus is on the front-end craft: how do you make a dashboard that looks good, loads fast, and remains readable across screen sizes?
Component Patterns
Stat Cards are the building blocks of most dashboards. A well-designed stat card communicates a metric, its trend, and its context in a small footprint. The best examples use typography hierarchy and subtle color to do the work rather than relying on icons or decorative elements.
Chart Components in this collection use SVG or CSS-based approaches rather than heavy charting libraries. Simple bar charts, line charts, and radial progress indicators can be built with remarkably little code when you understand SVG viewBox sizing and path data.
Data Tables appear in several pieces, focusing on responsive behavior, row highlighting, sortable headers, and how to handle horizontal overflow on narrow screens without destroying readability.
Layout Grids demonstrate how CSS Grid enables dashboard layouts that adapt meaningfully across breakpoints rather than simply stacking cards. The best dashboard grids maintain visual hierarchy at every size.
Performance Considerations
Dashboards tend to have many DOM elements, frequent data updates, and complex layout calculations. Keep the rendering pipeline in mind: avoid layout-triggering property changes during data updates, batch DOM modifications, and use CSS containment where supported to limit recalculation scope.
Related Reading
- CSS Architecture for Small Visual Projects covers organizing CSS for component-heavy interfaces
- Recreating Visual Shots in HTML and CSS applies to dashboard recreation work
- Navigation covers sidebar and tab patterns commonly used in dashboard shells